Real Estate Worksheet
This Google Sheets workbook is a template to help you track the details and finances of a real estate property you live in or rent.
Categories:
[finance],
[spreadsheets]
Tags:
[real estate]
This Google Sheets workbook is a template to help you track the details and finances of a real estate property you live in or rent.
This spreadsheet project captures some of the best practices I’ve learned along the way in buying and holding investment property. It’s not going to contain some amazing secret formula, nor is it going to guarantee you a successful investment. Instead, it supports you with some basic principles like diligently recording your income and expenses and tracking ROI. In doing so, you’re more likely to succeed.
This is written for residential real estate in California, USA. It’s not like it cannot be used elsewhere, but you’ll want to make adjustments match your local situation.
| Link | Description |
|---|---|
| Real Estate Workbook Template | The template you can copy and use for your own real estate purchase. |
| Primary Residence Example | An example of the workbook for someone who lives in it. |
| Rental Example | An example of the workbook for a rental property. |
| Github Page Coming Soon | A link to the workbooks Github page for submitting comments, problems, state-specific versions, or upgrading it. |
Version History
v.0.91 - 2020-06-11, Initial release. I’ve had other versions before but this one is the first I’m putting on the site.
Documentation
I know this should just be intuitive, and it is in a way, but it doesn’t hurt to understand how to get the most out of this template. Below are some details about how to use this tool to its fullest. I use this to manage several properties and it makes my life much easier.
Overview
The workbook is split across several tabs to help organize your material.
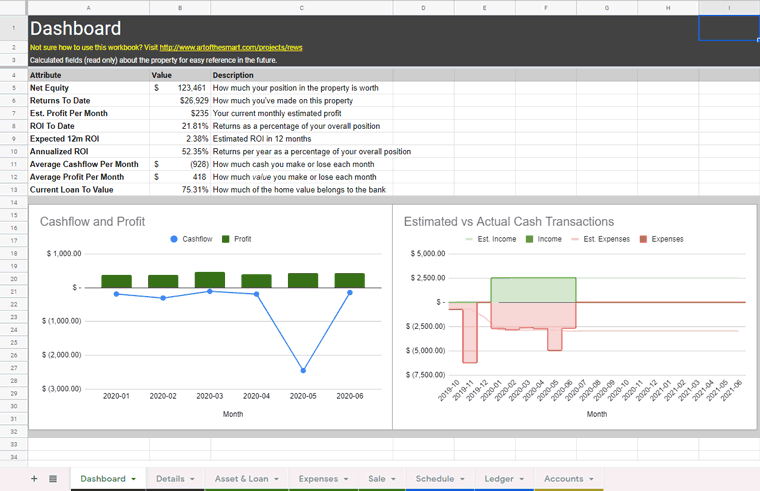
- Dashboard - Where you can see a few charts and graphs, plus some basic information.
- Details - Where more detailed figures and values are calculated. Good for seeing a more detailed digest of what’s going on financially.
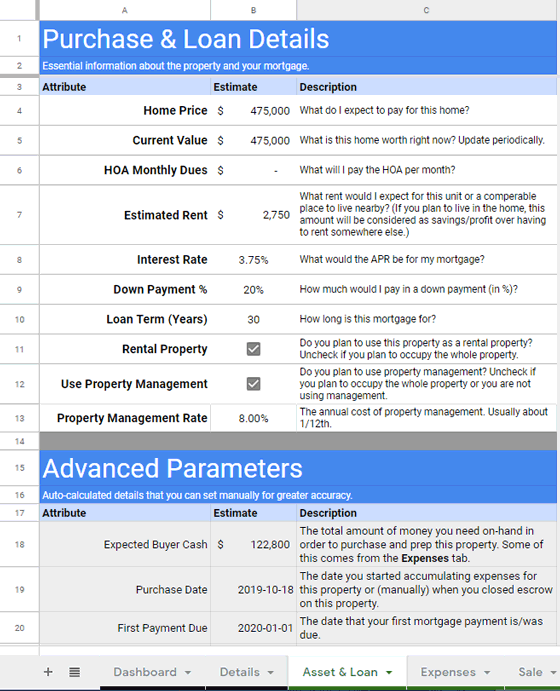
- Asset & Loan - Contains information about the property, its value, and the mortgage.
- Expenses - Contains estimates of annual expenses.
- Sale - Contains estimates about potentially selling the property. (work in progress)
- Schedule - Contains a schedule of mortgage payments, income, expenses, and profit.
- Ledger - Where you copy in your raw cashflows for calculation.
- Accounts - Where you write down usernames and passwords for related accounts.
Asset & Loan
Not much to say about this tab, fill in the white values with relevant details. Update your Current Value periodically from Redfin.com or Zillow.com to make sure profit calculations are accurate. Check back and forth with the Details tab where you’ll see useful info like estimated mortgage payments (after escrow) and estimated 12 month forecasted ROI.
Expenses
You can estimate your annual budgets for each of these items and have those factored into profit/loss forecasts. Whatever your estimates might be, they’re only 70% of the estimated value, with the other 30% coming from your actual monthly expenses in the last 12 months so don’t worry about getting these perfect. Remember that expenses are lumpy, so you should be setting aside cash each month for when things inevitably need repair or replacement.
Sale
Can’t say I tried hard on this tab because I haven’t sold in a while, but it’s useful to see ROI calculations based on how much cash you could reasonably get in a sale rather than how much equity you currently have.
Equity is deceptive. You might own $100,000 of the property, but if a sale would only net you $60,000, then it’s not really $100,000, is it?
Schedule
This is the workhorse of the spreadsheet and you do not need to edit anything in here. If you’re getting a lot of #N/A values, then you entered something wrong elsewhere. Here it calculates monthly mortgage payments and aggregates your monthly income and spending.
Cash in and cash out are obvious, but value out is different. That represents net worth you’ve lost through transactions that don’t (a) increase the cost basis of the property and (b) don’t increase your equity. These are usually costs associated with consumption (like utilities), insurance, and interest payments.
Each month starts on the 1st regardless of when your payments are, and the End Balance is always the value after that row’s payment.
Cashflow measurements help you know whether you’re accumulating or losing cash each month so you can budget accordingly, and profit columns track overall gain or loss in value.
Ledger
The workbook is meant to be used in combination with Mint.com and my Lazy Accounting Method. You create a new checking account only for this property and you use the associated debit/credit cards for any expenses related to the property. Each month you download and paste your transactions from Mint into the Ledger tab, taking care of the following.
- Delete any
Transfertransaction types. Transfers are usually money entering the checking account because it’s running low or leaving the checking account because there’s extra cash in there. Either way, your net worth didn’t change. Same pants, different pockets. The only transactions that should go in here are where you paid someone (mortgage, utilities, Home Depot, etc) or someone paid you (rental income). The rest are just noise and flummox the tool. - Download your data at least every other month. Mint.com can only look back 90 days with your financial institution. If you don’t log in at least that frequently, you will lose transactions. If that happens, you’ll end up with gaps in your history that you have to manually backfill and that’s really tedious. No one has time for that.
- Indicate which transactions added to the value of the home. This is called adding to the cost basis of the property, and it's when you’ve spent money to improve the value of the home. Read more about it in this Nolo article. You can designate transactions like this in the
Ledgertab in order to have them considered in profit calculations. - Copy down the
MonthandAmountcolumns as needed. If you add LOTS of rows to the Ledger sheet, you’ll need to make sure these two columns have their formulas repeated down. This is the only place you might have to do that.
Misc
There are other tabs you won’t need to worry about unless you’re trying to improve the spreadsheet. Chart Data is for holding data that feeds into the charts and Config is for UI stuff like field validation values.